WESTFIELD – At last night’s Westfield School Committee meeting, Superintendent Dr. Suzanne Scallion unveiled three years of data from Dynamic Indicators of Basic Early Literacy Skills or DIBELS.
“It’s a nationally used test and is probably the number one measure of early literacy skills,” said Scallion, adding that significant research has been done which correlates DIBELS to future success on the Massachusetts Comprehensive Assessment Systems (MCAS) exam.
Focusing on the city’s kindergarteners, Scallion said she would be unveiling the data from the next grade up.
“Because this data is looking at three different groups of kids, you’re going to see some normal variations between them,” she said.
Scallion said that comparing the data between groups is tricky with DIBELS, but that comparing the data of the same group over time will be done using an intense data analysis tool called Illuminate.
“We’re the first district in the state to be utilizing this tool and we have the people who can do that analysis in Jen Hurst,” said Scallion. “We’re working with the tech center and will really be able to extract some important data for our teachers to use.”
Scallion said that teachers today have to be “diagnosticians.”
“The day when we taught 20 kids at a time is over,” she said. “We now teach a small group of kids who understand the concept, so we make sure that when we move them forward, we give a small group of kids who need remediation what they need. We have small groups in our classrooms all the time.”
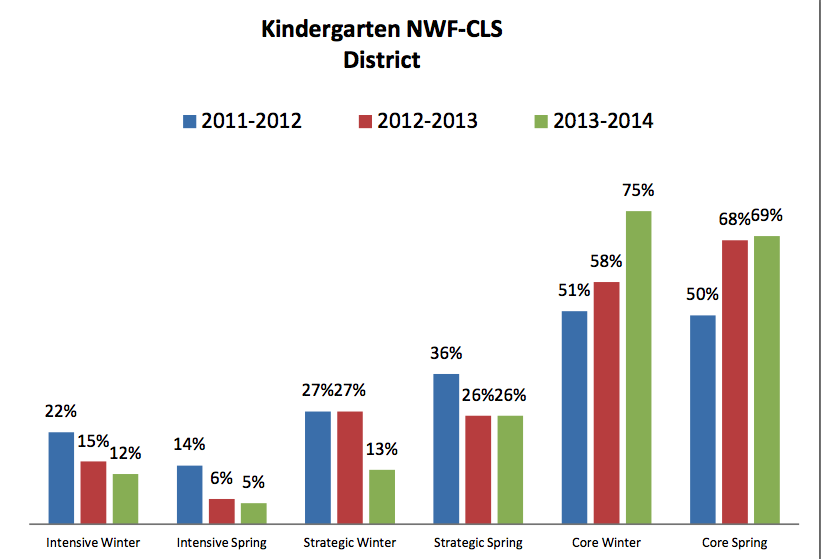
The single page of data is composed of color-coded bar graphs represented students at different schools in the district.
“We have different numbers of English language learners in our schools. We have students coming in with various strong literacy skills. We have students that have been to preschool,” Scallion said as sheets were dispersed. “Our kids are coming in with all different kinds of backgrounds.”
The district’s current kindergarteners have made major strides, according to the data sheet.
“Fifty percent of our kids in 2011 – as opposed to only eight percent of our kids last year – that’s remarkable,” she added. “If you look at last year, in the spring we were down as low as two percent intensive in kindergarten at Juniper (Park Elementary).”
Nonsense word fluency, a big research area currently as it relates to later comprehension, is what the DIBELS data seeks to uncover and the district’s kindergarteners show steady improvement year-over-year.
“You can look at all the schools and see a similar kind of change in the ‘intensive’ bar and you see the core at the end of the year… we should be up in the 70s and 80s,” Scallion said. “And if we’re not, we need to have a sit down and talk about how carefully are we implementing the program and paying attention to the diagnostic information.”
Kindergartners at Highland Elementary in the winter of 2013-2014 scored at 74 percent core, only to see that score tail off to 65 percent in the spring, which Scallion attributed to a high concentration of English learners at the school.
“We had an influx of Bhutanese kids by way of Nepal who came in last year, which probably impacted scores,” she said. “But these scores are remarkable for English learners. We’re proud of our kids and of our teachers. Those spikes – from three years ago compared to now – are great predictors of the future.”
Scallion added that only the district’s second graders have had three years of the new state Common Core standards.
“We did not adopt the Common Core in each grade at the same time,” she said, chalking it up to an estimated $200,000 price tag in each content area per grade to do so. “It will be very significant to look at our data in the fall of ’16, when our current third graders are in fourth grade and take their end-of-the-year exam.”
“We will do what I call the ‘matched cohort’ – that only those students who were with us in kindergarten and first grade – will be in the data we look at next time,” said Scallion regarding the data she would bring to the next meeting on October 20. “When we look at data, we’ve got to make sure we’re comparing apples to apples. Although this is a great preview, next week’s data will be even more exciting to look at.”
School Committee Member Bill Duval sought to clarify the difference between the three evaluative levels – intensive, strategic and core.
“Our kids who are ‘intensive’ are not at the level we expect them to be,” replied Scallion. “‘Strategic’ students are right on target for the end of the year and we expect those students to be ‘core’… by the end of the year. A child could be intensive in the fall when they arrive, but if they’re still intensive in the spring, then that’s a red flag that they’re not making good progress.”


