
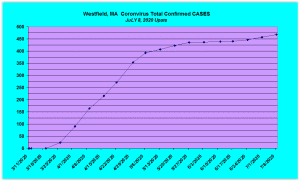
WESTFIELD-As weeks have turned into months tracking the COVID-19 pandemic across the globe, Peter Marengo has made it his mission to keep area residents informed with data-driven charts on the Experience Westfield and More and the Westfield MA Happenings Facebook pages.
“I began tracking the global and national coronavirus cases for my own use around the first week of March,” said Marengo. “At the time, there were only a handful of confirmed infections in the United States, and none in Massachusetts.”

Peter Marengo of Westfield shares his COVID-19 tracking charts with local residents each week on two community forum sites. (SUBMITTED PHOTO)
Since Marengo prides himself in keeping up with current events, he said he first saw the “seriousness and ramifications” of the pandemic in northern Italy developing in late February, and how rapidly it was spreading.
“At that time, data pertaining to the virus was sparse so I started searching and grabbing what information I could from various sources and consolidated it into a spreadsheet for my own use,” he said.
Marengo said in early March he was hearing that China was “flattening the curve” but there were few charts available to support the claim.
“I decided to design my own graphs based on the data in order to visually see the changes,” he said.
Peter Marengo of Westfield updates his COVID-19 master tracking chart each week and shares the information on Westfield community forum pages.
Marengo said it took a few days to experiment with various spreadsheet layouts, formats and formulas to find the right combination to help him compile global, national, state, Hampden County and Westfield COVID-19 data.
“Initially I was updating the data and charts daily and was spending two to three hours each day gathering data and making the updates,” said Marengo, adding, “It became less time-consuming as accurate data sources became more readily available.”
Marengo noted he uses the “most trusted sources” for his data-driven charts, including the Johns Hopkins University coronavirus tracking website for global and national data, the mass.gov COVID-19 daily dashboard for state and Hampden County data, and the City of Westfield’s website that has COVID-19 information and bulletins.
Peter Marengo of Westfield updates several COVID-19 charts each week that center on Westfield statistics.
“The Westfield coronavirus deaths are reported on the city’s website on Wednesday afternoons so I update my charts after 6 p.m. each Wednesday,” he said.
Marengo said he has had an “overwhelmingly positive response” from community forum members on his charts.
“My overall goal is simply to consolidate global, national, state, regional and local coronavirus pandemic statistics into an easily understood form, and to share that data with others as a community service,” he said.
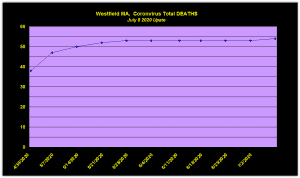
Peter Marengo has created several charts over the past few months on the COVID-19 pandemic, including the number of deaths from coronavirus in Westfield. He said the chart starts on April 30 because the city was not publishing the death statistics before that date.
Marengo, who was born and raised in Westfield, spent his career in hotel management which landed him in communities from Virginia Beach, Va., to Charlotte, N.C., and then to Pigeon Forge, Tenn., and on to Norfolk, Va. His last stint in the hotel industry was working in the Berkshires.
“In the end, I did the opposite of many people, and moved back north to my snowy hometown to retire,” said Marengo.
The skills he acquired over the years in hotel management, from accounting and market forecasting to data interpretation, now serves him well as he collects the COVID-19 data each week, not only for his information but to inform others who too may be interested in viewing trends.
“I’m a senior citizen and it feels good to be able to put my skills to some practical, useful purpose,” said Marengo.
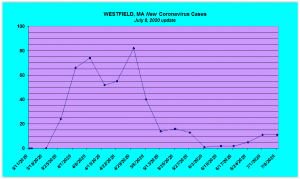
Peter Marengo of Westfield began tracking weekly coronavirus cases in Westfield that were reported in early March.
While Marengo acknowledges that some forum comments on his data charts have been “hateful,” he stresses he is sharing his charts “purely for informational purposes in the midst of the most severe global and national pandemic in over a century.”
“I was dumbfounded at some of the hateful comments that were made by people who believed that the coronavirus pandemic was/is a hoax,” he added.
Over the past few months some forum members have also asked Marengo if he could add statistics for the number of people who have had COVID-19 and recovered.
“The answer is that I cannot,” said Marengo. “As far as I have been able to determine, those statistics are not available, mainly, I would guess, because there are so many current active cases. There won’t be an accurate count of those who have recovered until after the pandemic is ended when we can subtract the number of deaths from the total number of confirmed cases. At least that’s how I see it.”
Marengo said he expects to maintain the coronavirus tracking project “as long as the pandemic lasts; I am physically able, and feel that it is useful to others.”
While areas of the country and around the globe are now seeing spikes in new cases, Marengo said he is not surprised.
“I can say I’m saddened but not surprised by it,” he said. “I think Gov. Baker has done a fantastic job and we are better off than most of the states. What is most troubling is seeing so many people still ignoring the rules, so I’m not surprised at the spikes.”
Marengo said as he compiles the data each week he never forgets “that each number represents a human being – a person with a life, loved ones, family, friends, a job, hopes and dreams.”
Marengo added it is far too easy to look at numbers that are in the millions and only see statistics.
“The statistics are people who are suffering or dying,” he said, adding, “but they take on a whole new meaning when one realizes that these are our neighbors and fellow global citizens.”