
WESTFIELD—When it comes to the city’s public drinking water, people may be surprised to know just how strict and all-encompassing the process is to provide residents with safe water.
The process reveals a lot about the city’s public water supply and its makeup, and city officials contend that the system is comprehensive and efficient. The testing is done on the city’s eight water wells–currently six, due to two being offline–as well as the Granville reservoir. Through the testing, which is done year-round, the Westfield Water Department is able to track and catalogue each contaminant in the water, while maintaining strict water standards set by the Environmental Protection Agency (EPA). This testing can be confusing though, especially when the results don’t show the same contaminants year to year in consumer confidence reports (CCRs).
A cup is filled with water at a sink (file photo)
“There is a schedule of testing that the EPA develops, it’s extremely detailed and extremely long,” Heather Miller, water systems engineer for the city, said. “What happens is there’s a long list of things that we test for, but it only gets reported if it’s detected.”
The contaminants that are found are reported each year to residents through a CCR. For those unfamiliar, the CCR is a culmination of the testing that is done throughout the year and is mandated by the EPA to be distributed to water customers. The data is comprehensive and is totaled from the entire year’s worth of testing. The compilation of the data for city-wide results takes several months to compile, so the results from one year’s testing may not go out to the public until the following June. As an example, in spite of 2016 testing occurring year-round, that data will come out to the residents via CCR around June 2017.
The results from testing are shown to consumers through the CCR and additional information about the water, as well as any violations that the department may have had, are catalogued on the document. Also on the document you will see the maximum contamination level (MCL), which is the highest amount allowed per regulations, as well as the maximum contamination level goal (MCLG), which is the maximum amount of a contaminant that they desire.
So, when a resident receives a CCR they may see some apparent discrepancies regarding contaminants that are listed. However, there is not a discrepancy, but instead the contaminant was not detected in the water system and this is generally considered to be good.
An example of this is chromium, which is a byproduct of steel and pulp mills and is also a natural deposit. In 2015, chromium was found in the water at 0.44 parts per billion (PPB), but from 2011 to 2014 none was listed. Then, from 2006 to 2010 the inorganic contaminant was found between 1.1 and 2.2 PPB. When chromium was found in the water, all of the levels were well below the total allowed of 100 PPB, but since they were detected they had to be reported.
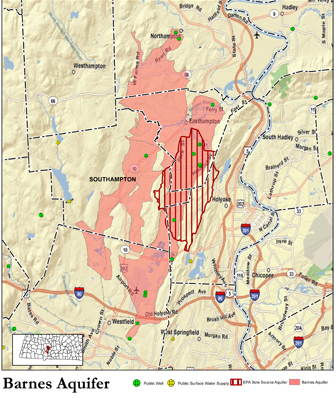
Barns Aquifer map from the BAPAC website, which supplies a majority of water to Westfield and was partially impacted by firefighting foam.
For some items though, there is no MCL or MCLG that is listed, such as the much talked about firefighting foam (like that found on Barnes Regional Airport) compounds perfluorooctanoic acid (PFOA), perfluorooctane sulfonic acide (PFBuS) and perfluorooctanesulfonic acid (PFOS). In spite of this, these contaminants–which are contaminants of concern that have not been regulated yet but are typically being tracked by the EPA—have totals reported if they are found in the water.
Other items like this include nickel, sulfate, chromium, strontium, vanadium, hexavalent chromium, chlorate, dioxane and manganese. A majority of these chemicals come from natural deposits and are naturally reoccurring in water. However, some contaminants like chlorate, which is a byproduct of sanitization, or dioxane, which is a discharge from chemical manufacturing and landfills, are a product of humans.
Additional testing is also done to find lead and copper, which are found due to corrosion of household plumbing and can be detrimental to human health, as well as total coliform bacteria, which isn’t harmful to humans but can be an indicator of harmful bacteria in water.
For each of these contaminants, there are a variety of methods, time intervals and places for the testing. And while compilation of the CCR takes time, the results from the testing are always being catalogued and reacted to by Westfield Water Department. If there is a finding that is of concern, such as coliform bacteria totals, they will re-test and attempt to fix or mitigate the problem as soon as they are aware.
“There are sampling criteria for each of the different tests,” Miller said. “For example, the lead and copper testing is done at 30 different sites and those are taken by the individual homeowners at the sites and taken after six hours of nonuse.
“Other samples like total coliform sampling is done on a weekly basis and is done through sample taps and various identified spots throughout the system; other samples that are taken by labs, they actually come out and do the sample draw themselves. The procedure for individual samples vary significantly.”
In addition, Miller said that some tests, like the lead and copper, are done every three years, while chlorine levels are constantly monitored. Other tests happen once a month, once a quarter or once a week. Other testing, such as the testing of PFOS and PFOA, may find levels that are concerning but that are not part of the EPA regulations yet, and the city still takes a precautionary approach by taking water wells effected offline once results showed the problem.
If all this wasn’t enough though, the city also reports on its violations, if any, on the CCR every year. Since 2006, the city has a total of 10 violations, with none happening in 2006, 2007, 2009 and 2015. The most occurred in 2010, when the city had three violations. These violations may not be water-related, however. Miller said that some of the violations—which occurred before she was hired—were administrative deadlines and did not inhibit the quality of Westfield water.
Following were the violations since 2006:
2008: Two violations; in January the proper amount of coliform samples were not gathered; in July coliform was found in 5.6 percent of samples, which is beyond the 5 percent MCL
2010: Three violations; in March there was 10.2 percent finding of coliform, over the 5 percent limit; in July 13 percent coliform found; in October a testing of perchlorate was done but not submitted in time
2011: One violation; the CCR was not sent out on schedule to residents
2012: Two violations; third quarter testing was not properly done for synthetic organic chemicals; in June coliform was found in 15 percent of samples
2013: A sample for testing was submitted 13 days late
2014: In June, coliform was found in greater than 5 percent of the samples
Overall, Miller believes that the water is safe and that the numbers show it.
“We really do have a pretty good system, we don’t have a lot of problems with respect to contamination or leaks,” she said. “There are other communities with much more extensive problems with their systems.”
In fact, in 2015 Massachusetts alone had 76 health-related violations occurring in the state’s water systems, which includes contaminations or coliform findings. Meanwhile, Westfield had four such violation since 2006.
And like other city officials, Miller contends that the water is not only safe to drink, but that she drinks it herself.
“I tell people based on all of our testing and all of our results the water is safe to drink,” she said.